- F-Test 는 One-way ANOVA 분석과 동일함
- P -value 0.05수준에서 기준 F 값(0.25?) 을 Critical F-value로 설정하고 계산된 F값을 비교함 ![[안정성시험 분석-20240119222104752.webp|500]]
- 3개 배치 자료에 대해 전체 ANOVA 분석을 하고
- model <- lm(assay ~ batch * time, data = data)
- 공통의 기울기와 절편을 사용할 수 있는지 판단하고
- 개별 기울기를 적용할 때는 공분산분석으로 적용하여 회귀분석실시
- lm(formula = assay ~ batch + time, data = data)
- time (-0.1635) 이 공통 기울기로 사용.
ANCOVA 분석
![[안정성시험 분석-20240120183915613.webp|500]] - ⍺ and β are the intercept and slope of the batch - εt : model error term that follows Nð0; sÞ distribution - ⍺0 and β0 are the common intercept and slope of all batches respectively - ⍺i and βi are the deviation of individual intercept and slope of the i-th batch from ⍺0 and β0 respectively.
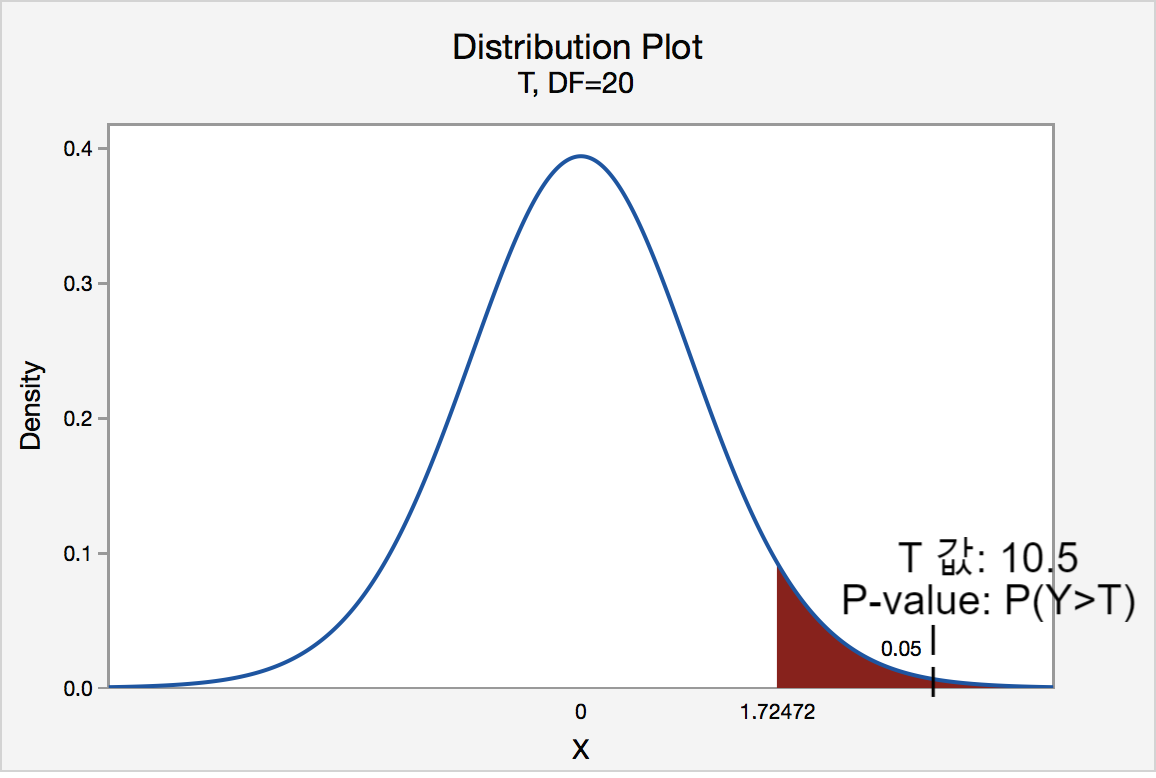
검정통계량 T 분포 그래프
 출처 : [[p-value란 p-value 사용 시 주의할 점]]
참고
- [[F-test (ANOVA) 이해 Hands-on Calculation]]
[[환영합니다!]]
[[미국 과초산 규제비교.html]]